Spring Boot and Zipkin for Distributed Tracing
In this post, We will learn how to use Zipkin with Spring Boot for distributed tracing.
Spring Boot is currently the first choice of Developers to create microservices. With multiple services in place, Traceability of a single request can be cumbersome. Here is Zipkin to the rescue.
Zipkin Architecture
Zipkin is a distributed tracing tool that has two components. One is part of the application service itself that collects data and a tracer(instrumentation) library that reports to the said server. This tracer library is supposed to sit along with the application while running. Here is a simple architecture illustration from Zipkin’s official site.
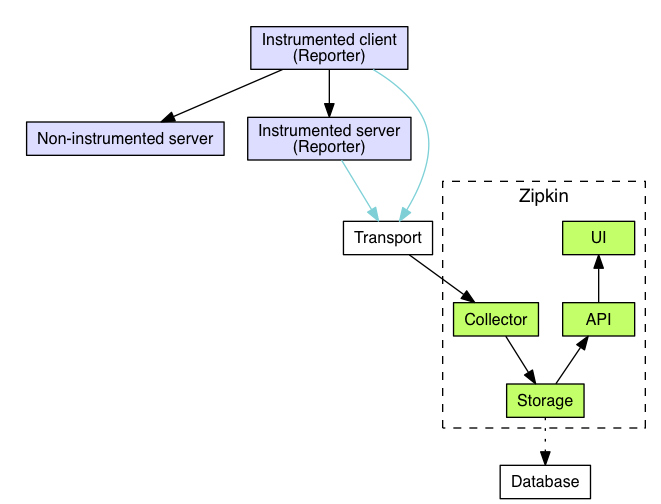
As you see in the architecture diagram, All applications that have a Reporter contacts Zipkin collector and provides information. This information usually in the form of a specification called B3 propagation.
B3 Propagation and tracing specification
B3 specification is a set of HTTP headers for passing Trace information from one application to another. Let’s say you have service A which calls Service B and Service B calls Service C. Zipkin uses this format to forward trace information between Spring Boot and Zipkin Server
In this scenario,
- The whole journey is called a transaction.
- Each API call is a span. Technically a single unit of operation is span. But for this example, each API call is an operation.
- Along with these two facts, there is also a correlation between parent and child spans. In this example, the API call done on A triggers an API of B. So A is the parent of B. Similarly operation at B is the parent of the API call to C.
all the above information is what we call as Trace information or Trace Context. This context is supposed to be passed from parent to child so that the instrumenting agents on each application can get this information and forward it to Zipkin central server.
Here are the B3 headers comes in place. As the applications communicate using HTTP, all this information can be encoded as HTTP headers and passed down.
Here is the List of B3 headers.
Zipkin TraceId
For every transaction, Zipkin starter generates a unique TraceId encoded in hex. The header key for this is X-B3-TraceId. This value won’t change throughout the journey of the transaction.
SpanId
A SpanId is a 64-bit hex value that indicates the current operation/API call. The header key for this is X-B3-SpanId.
ParentSpanId
Every API call may or may not have subsequent calls to other services. If they do have subsequent calls, then we can form a tree of all these API calls. This situation is where the X-B3-ParentSpanId header comes in picture. The Parent Span Id is the span id of the parent API call or operation. When Zipkin server gets all the trace context from all the servers, it can arrange the trace tree structure using the ParentSpanIds.
Sampling State
The header X-B3-Sampled takes a 1 or 0 on whether to trace the subsequent spans or not. This decision is made on a 0.1 probability(10%) by default. What this means is that at the root span, the Trace reporter may or may not create a context based on a random probability. We can force the reporter to sample using three ways. * Call the Root Span with X-B3-Sampled as 1 * Set the default tracing probability to 1 (100%). We will get to this later. * Call using Debug flag
Debug Flag
X-B3-Flags: 1 is the representation for DEBUG flag. Any other value of absence of this header would mean that the trace is not in debug mode. Also, In debug mode, the trace decision probability is 1 (Always trace.). This header is helpful in production where you want to make sure that the Zipkin will trace that transaction.
So A typical set of headers for an intermediate span would look like below.
X-B3-TraceId: 98dcb578d3c0dec17f57a9950b28bcd0
X-B3-ParentSpanId: cf6cf79caba2eb97
X-B3-SpanId: ee802197f3d49d5f
X-B3-Sampled: 1Code language: HTTP (http)
Enough with the technical stuff. Let’s try a simple Zipkin setup.
Setting up a Zipkin Server
The server setup is straight forward. Zipkin Server is an executable Jar that can directly be downloaded from Maven repository. If you are using Linux, you can run the following command to download and start the Zipkin server.
$ curl -sSL https://zipkin.io/quickstart.sh | bash -s
$ java -jar zipkin.jarCode language: JavaScript (javascript)
There is also a docker image available for quick startup.
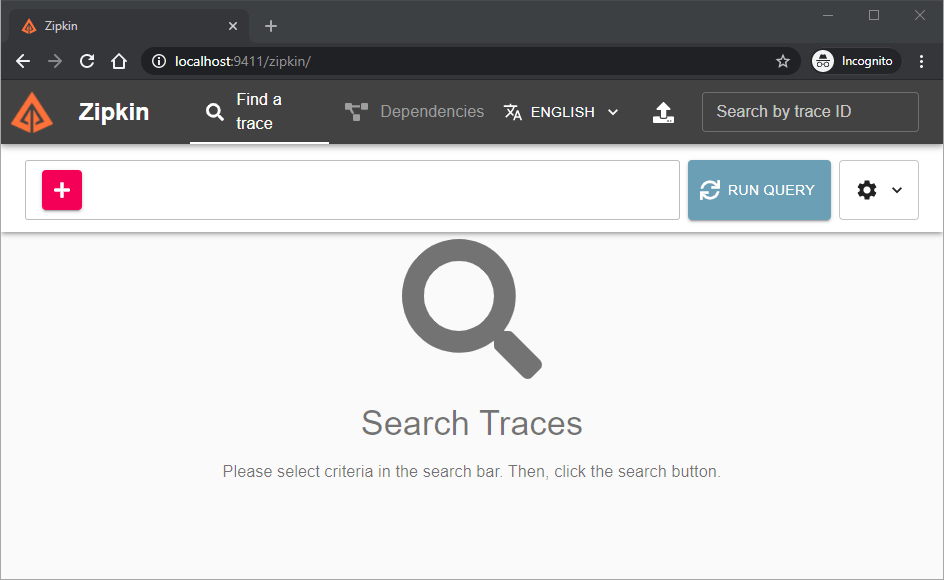
docker run -d -p 9411:9411 openzipkin/zipkinOnce you start the jar or docker image, the application UI will be available at http://localhost:9411.
Spring Boot Zipkin dependencies
Zipkin has a Spring Boot starter which is part of the Spring Cloud ecosystem. And all of their dependencies are managed within spring-cloud-dependencies pom. To add Zipkin to your project, You need to bring in spring-cloud-dependencies as a managed dependency.
So first add the following dependencyManagement snippet. If you already have a dependency management setup, add just the dependency tag in an appropriate place.
  <dependencyManagement>
    <dependencies>
      <dependency>
        <groupId>org.springframework.cloud</groupId>
        <artifactId>spring-cloud-dependencies</artifactId>
        <version>Hoxton.SR8</version>
        <type>pom</type>
        <scope>import</scope>
      </dependency>
    </dependencies>
  </dependencyManagement>Code language: HTML, XML (xml)
Next, you need to bring in the spring boot starter for Zipkin. This step is as easy as adding any other starter. Just include the following artifact to the dependencies list.
<dependency>
    <groupId>org.springframework.cloud</groupId>
    <artifactId>spring-cloud-starter-zipkin</artifactId>
</dependency>Code language: HTML, XML (xml)
Above all, You can generate the same settings from start.spring.io by selecting
Zipkinas a dependency.
Zipkin And Spring Boot in Action
Meanwhile, We created a /hello Rest API endpoint that calls a URL configured in the properties file.
@RestController
@SpringBootApplication
public class ZipkinDemoApplication {

    @Autowired
    private RestTemplate restTemplate;

    @Bean
    public RestTemplate restTemplate() {
        return new RestTemplate();
    }

    @Value("${spring.application.name}")
    private String appName;

    @Value("${target.service.url}")
    private String target;

    @GetMapping("/hello")
    public String sayHello() {
        return appName + " to > "
                + restTemplate.getForObject(target, String.class);
    }

    public static void main(String[] args) {
        SpringApplication.run(ZipkinDemoApplication.class, args);
    }

}Code language: JavaScript (javascript)
The idea here is that just by changing the server.port and target.service.url, I can simulate one service calling another service.
Point Spring Boot to Zipkin Server
The first thing to do here is to point our Spring Boot application to Zipkin server. Along with this, we will have to specify how the collectors are supposed to communicate to the central Zipkin server. (Current options are ActiveMQ, RABBIT, KAFKA and WEB). We will use the WEB sender type. To make sure that the Zipkin Reporter samples all requests, I’m setting up the sampler probability to 1.
Never set probability as 1 in production for two reasons. Make sure you consider these points into account.
- Your application will become slow.
- Zipkin central server will get a huge load.
I have specified these settings in the application properties.
spring.zipkin.base-url=http://localhost:9411/
spring.zipkin.sender.type=web
spring.sleuth.sampler.probability=1.0Code language: JavaScript (javascript)
Along with these, we will be passing server port, target URL and the application name as spring boot command-line parameters. This approach gives the flexibility to start as many services as we want under different ports.
The following set of commands builds the project and starts three instances of the demo application with different port and endpoint URLs.
mvn clean install
java -jar -Dspring.application.name=APP-1 -Dserver.port=8001 \
          -Dtarget.service.url=http://localhost:8002/hello   \
          zipkin-demo-0.0.1-SNAPSHOT.jar
java -jar -Dspring.application.name=APP-2 -Dserver.port=8002 \
          -Dtarget.service.url=http://localhost:8003/hello   \
          zipkin-demo-0.0.1-SNAPSHOT.jar
java -jar -Dspring.application.name=APP-3 -Dserver.port=8003 \
          -Dtarget.service.url=https://run.mocky.io/v3/ed8d9ae2-7d0d-4411-8b8c-66106d8a2721 \
          zipkin-demo-0.0.1-SNAPSHOT.jarCode language: JavaScript (javascript)
If we set it up correctly, We would have three applications in such a way that, APP-1 calling APP-2 and APP-2 calling APP3 and APP-3 calling mock service.
Let’s call the API for APP-1.
$curl http://localhost:8001/hello -iv

GET http://localhost:8001/hello

HTTP/1.1 200
Content-Type: text/plain;charset=UTF-8
Content-Length: 54
Date: Wed, 04 Nov 2020 15:36:04 GMT
Keep-Alive: timeout=60
Connection: keep-alive

APP-1 to > APP-2 to > APP-3 to > {
  "status" : "OK"
}Code language: PHP (php)
The output tells us the flow from APP-2 to APP-2 to APP-3 and so on. This output proves that our setup worked. Let’s check the Zipkin server UI.
Navigating through Zipkin UI
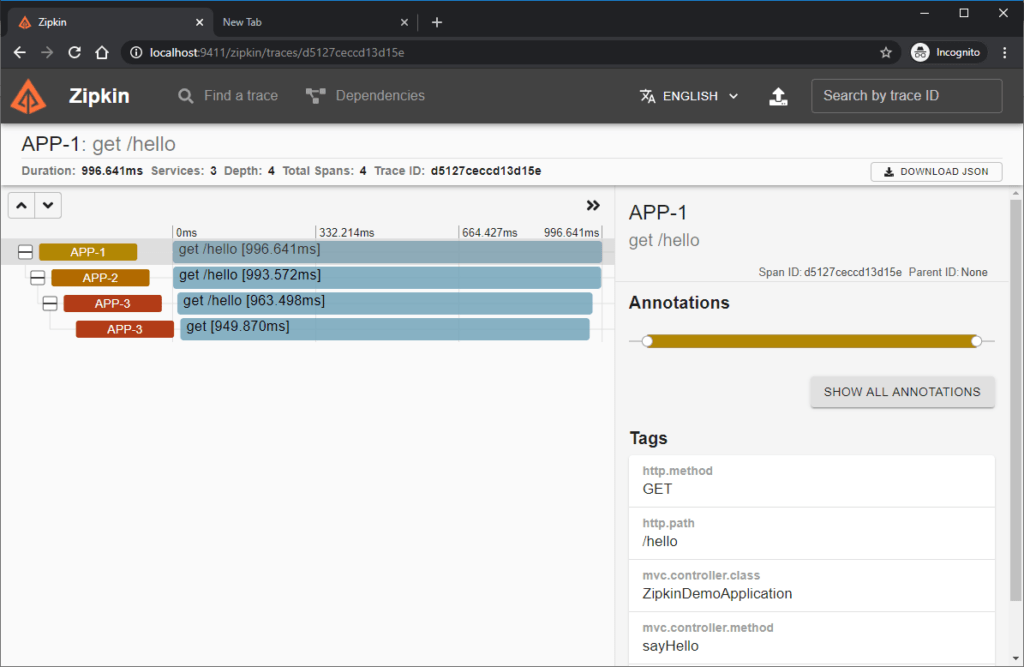
Select RunQuery -> Expand All and you see that there is one new trace. As you see, this trace was created for a transaction that happened between app-1,app-2 and app-3. By clicking show on that entry, We can see How the calls happened and how much time each subsequent spans took. And by selecting each of the spans, We can even see the spanId and parent ID.
All of these may seem magic. But under the hood, the Zipkin starter is intercepting all requests on each application and adding these span id and transaction ids. Meanwhile, the reporter will send this information to the central Zipkin server.
Let’s take a look at the logs. If you have seen the properties file I have mentioned before, I have marked the logging level as debug. This setup will show us the HTTP headers for each request.
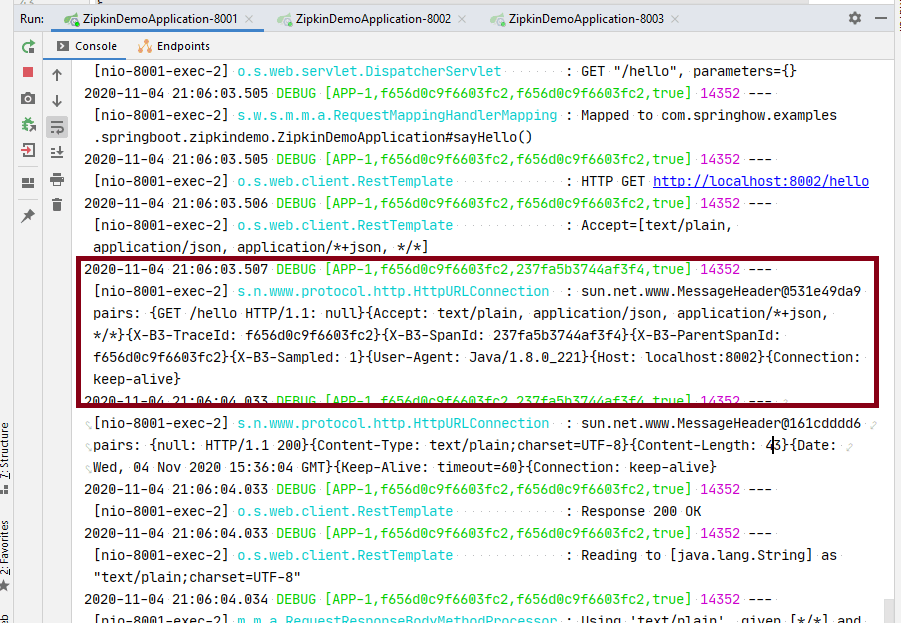
The highlighted segment shows which headers the APP-1 is sending to APP-2. Feel free to experiment with these headers yourself.
The best part about the Zipkin starter is that no additional code change needed and there is no side effect. The span in the UI gives a list of tags that would carry the information about the controller method, method type, etc.
Conclusion
To summarize, We learned how to add Zipkin distributed tracing for Spring Boot applications to trace between multiple microservices.